How to show the queries log in MySQL?
Sometimes you need to monitor all the queries sent to the MySQL server during a period of time. MySQL Server provides a way to show the general query log and the slow query log, if those logs are enabled. Possible destinations for log entries are log files or the general_log and slow_log tables in the mysql system database.
In this post, we are going to enable general log and slow query log and show them in tables in MySQL.
1. First, check if you already have the two tables slow_log and general_log existing in the mysql database.
If not, you have to create them, note that you have to create in the mysql database.
- To create the
general_logtable:
  CREATE TABLE `general_log` (
   `event_time` timestamp NOT NULL DEFAULT CURRENT_TIMESTAMP
                          ON UPDATE CURRENT_TIMESTAMP,
   `user_host` mediumtext NOT NULL,
   `thread_id` bigint(21) unsigned NOT NULL,
   `server_id` int(10) unsigned NOT NULL,
   `command_type` varchar(64) NOT NULL,
   `argument` mediumtext NOT NULL
  ) ENGINE=CSV DEFAULT CHARSET=utf8 COMMENT='General log'
The general query log is a general record of what mysqld is doing. The server writes information to this log when clients connect or disconnect, and it logs each SQL statement received from clients. The general query log can be very useful when you suspect an error in a client and want to know exactly what the client sent to mysqld.
- And the
slow_logtable
  CREATE TABLE `slow_log` (
   `start_time` timestamp NOT NULL DEFAULT CURRENT_TIMESTAMP
                          ON UPDATE CURRENT_TIMESTAMP,
   `user_host` mediumtext NOT NULL,
   `query_time` time NOT NULL,
   `lock_time` time NOT NULL,
   `rows_sent` int(11) NOT NULL,
   `rows_examined` int(11) NOT NULL,
   `db` varchar(512) NOT NULL,
   `last_insert_id` int(11) NOT NULL,
   `insert_id` int(11) NOT NULL,
   `server_id` int(10) unsigned NOT NULL,
   `sql_text` mediumtext NOT NULL,
   `thread_id` bigint(21) unsigned NOT NULL
  ) ENGINE=CSV DEFAULT CHARSET=utf8 COMMENT='Slow log'
The slow query log consists of SQL statements that take more than long_query_time seconds to execute and require at leastmin_examined_row_limit rows to be examined. The slow query log can be used to find queries that take a long time to execute and are therefore candidates for optimization.
The minimum and default values of long_query_time are 0 and 10, respectively. The value can be specified to a resolution of microseconds.
2. Enable Query logging on the database
SET global general_log = 1;
SET global log_output = 'table';
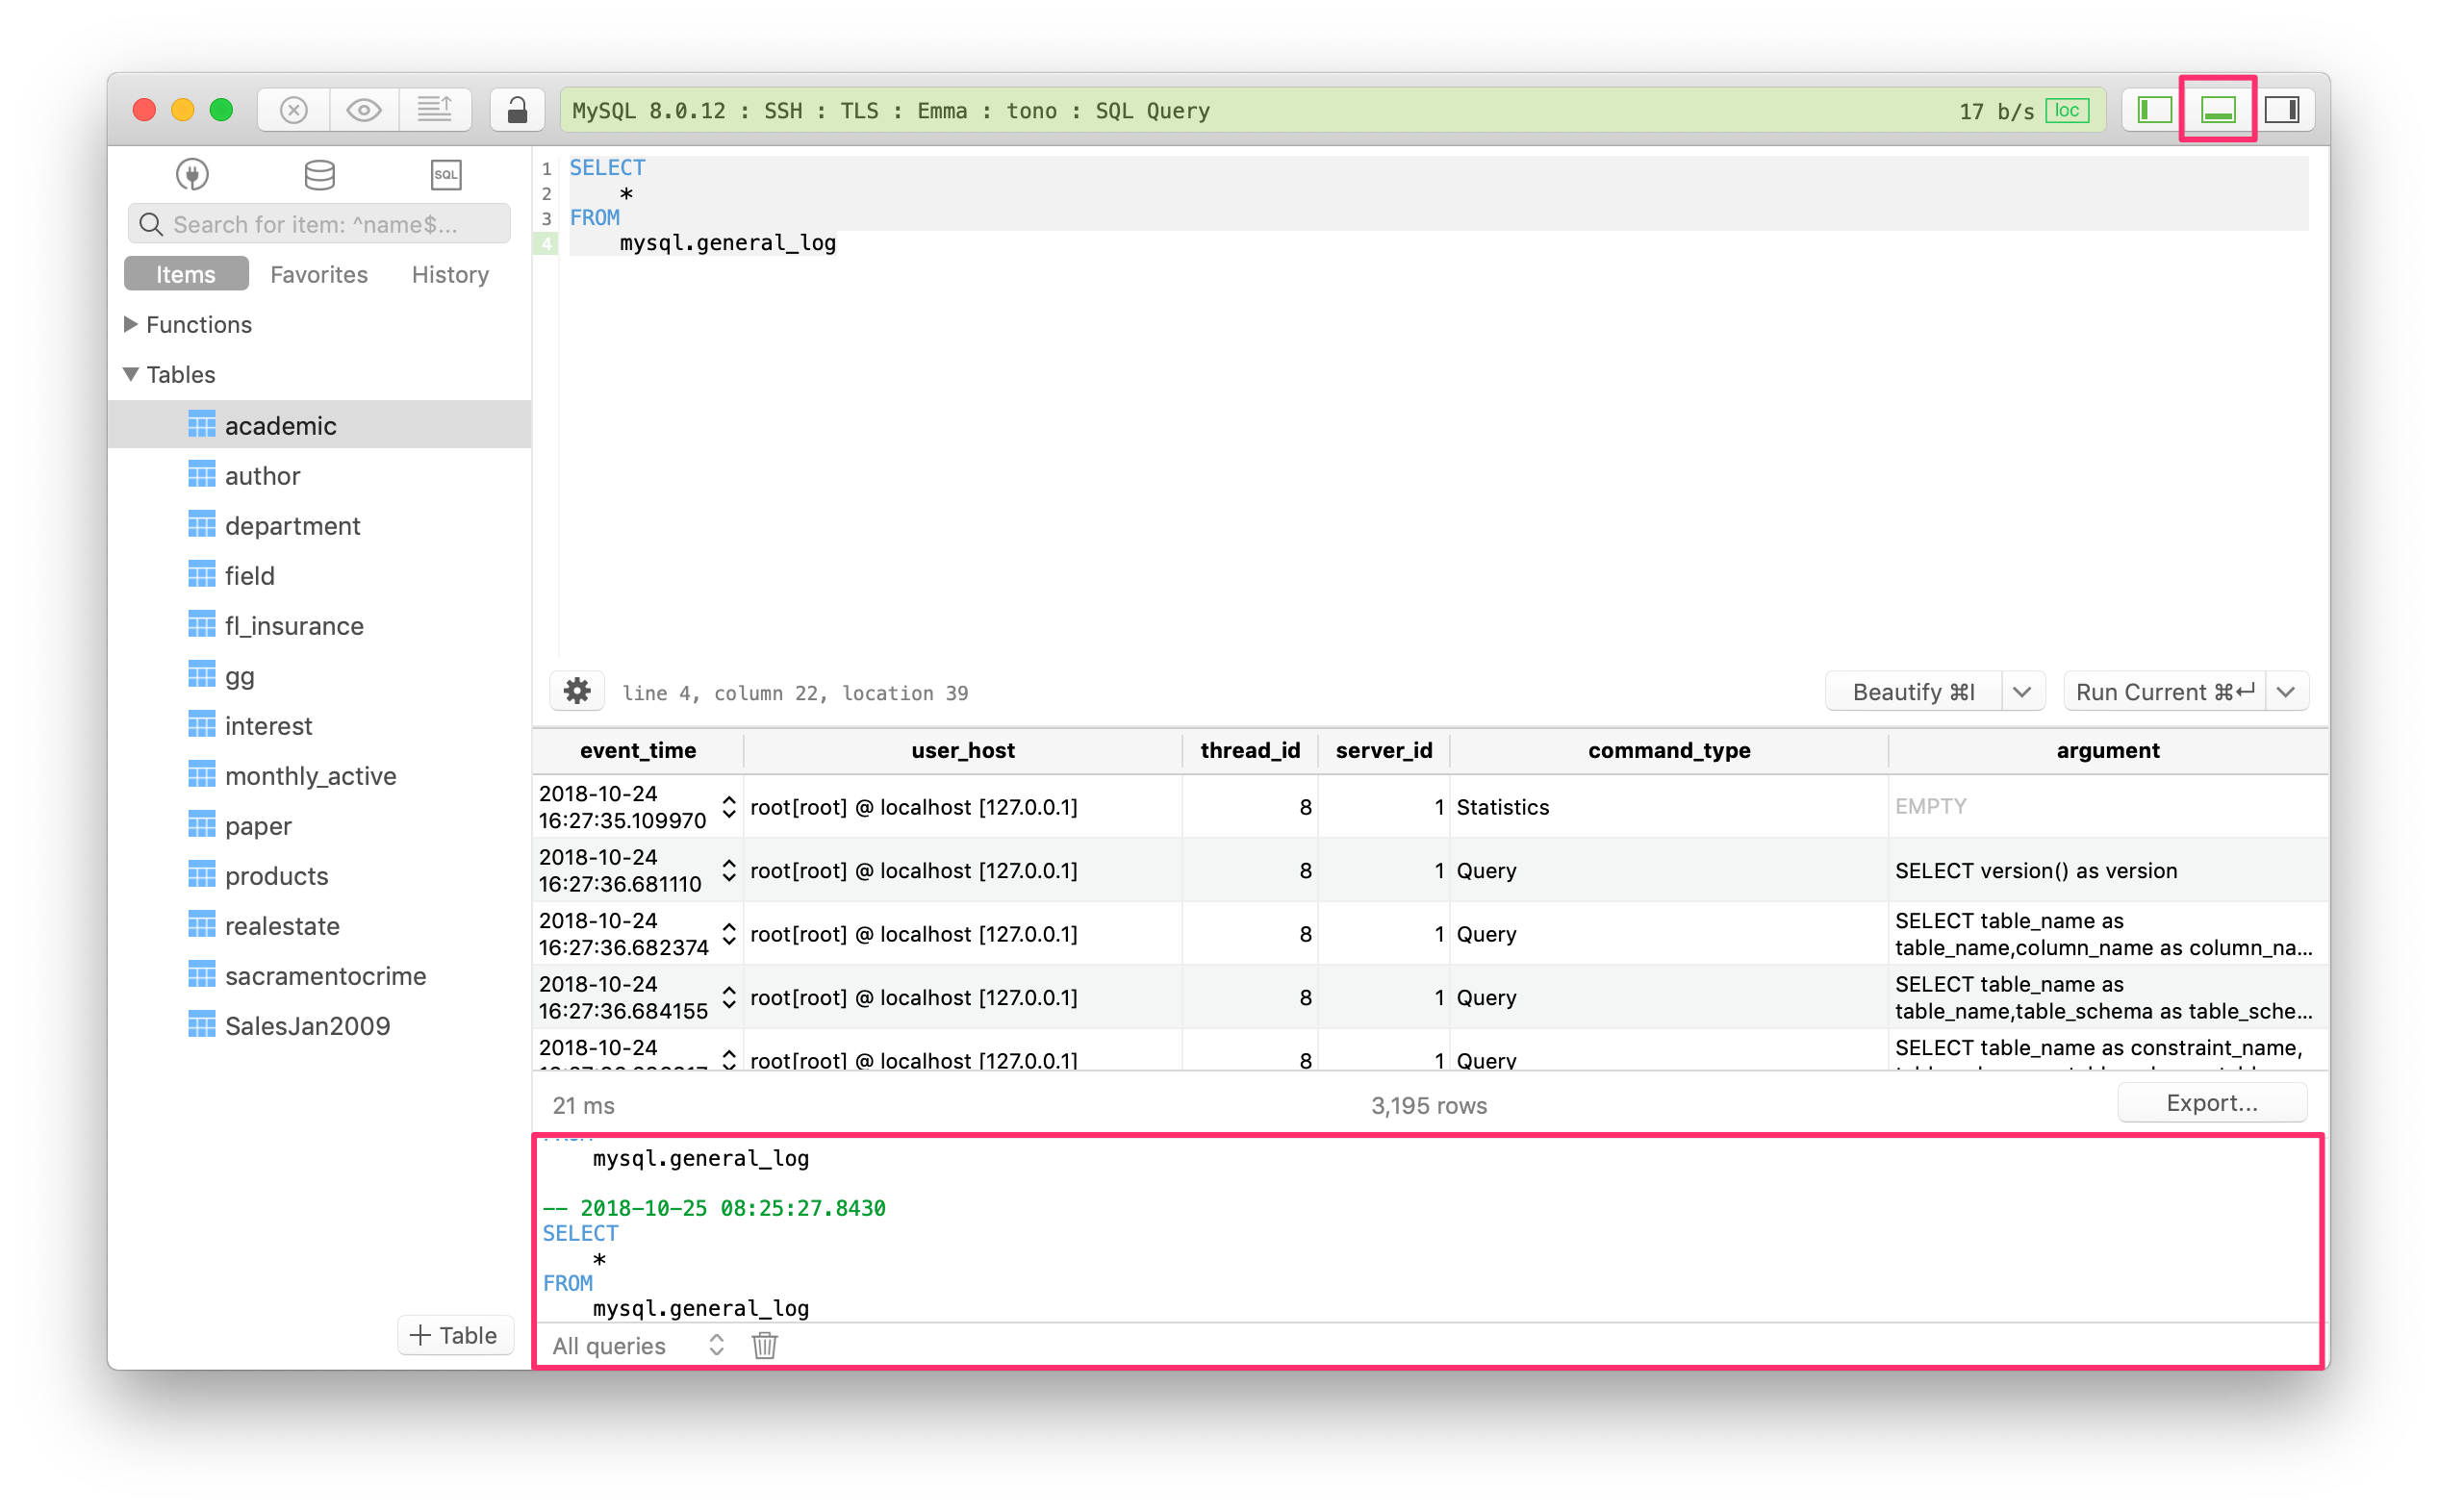
3. Now you can view the log by running this query:
SELECT
    *
FROM
    mysql.general_log;
4. If you want to disable query logging on the database, run this query:
SET global general_log = 0;
Using TablePlus, you can enable the console log from the GUI.
To turn on/off the log, click on the console log button near the top right, or use shortcut key Cmd + Shift + C.
You can also choose to log data queries, meta queries, or all queries.
New to TablePlus? It’s a modern, native tool with an elegant GUI that allows you to simultaneously manage multiple databases such as MySQL, PostgreSQL, SQLite, Microsoft SQL Server and more.
Download TablePlus here. It’s free anyway!