How to show queries log in PostgreSQL?
In this post, we are going to discuss how to log all executed queries for inspection later in PostgreSQL.
1. First, you have to enable logging all queries in PostgreSQL.
Please note that only those queries that are executed can be logged.
To do that, you have to config the PostgreSQL configuration file postgresql.conf.
- On Debian-based systems it’s located in
/etc/postgresql/9.3/main/(replace 9.3 with your version of PostgreSQL) - On Red Hat-based systems in
/var/lib/pgsql/data/.
If you still can’t find it, then just type $locate postgresql.conf in terminal, or execute the following SQL query:
SHOW config_file;
Then you need to alter these parameters inside PostgreSQL configuration file.
log_statement = 'all'
log_directory = 'pg_log'
log_filename = 'postgresql-%Y-%m-%d_%H%M%S.log'
logging_collector = on
log_min_error_statement = error
On older versions of PostgreSQL prior to 8.0, replace 'all' with 'true' for the log_statement:
log_statement = 'true'
2. Then restart the server
Run this command:
sudo /etc/init.d/postgresql restart
or this
sudo service postgresql restart
The content of all queries to the server should now appear in the log.
3. See the log
The location of the log file will depend on the configuration.
- On Debian-based systems the default is
/var/log/postgresql/postgresql-9.3-main.log(replace 9.3 with your version of PostgreSQL). - On Red Hat-based systems it is located in
/var/lib/pgsql/data/pg_log/.
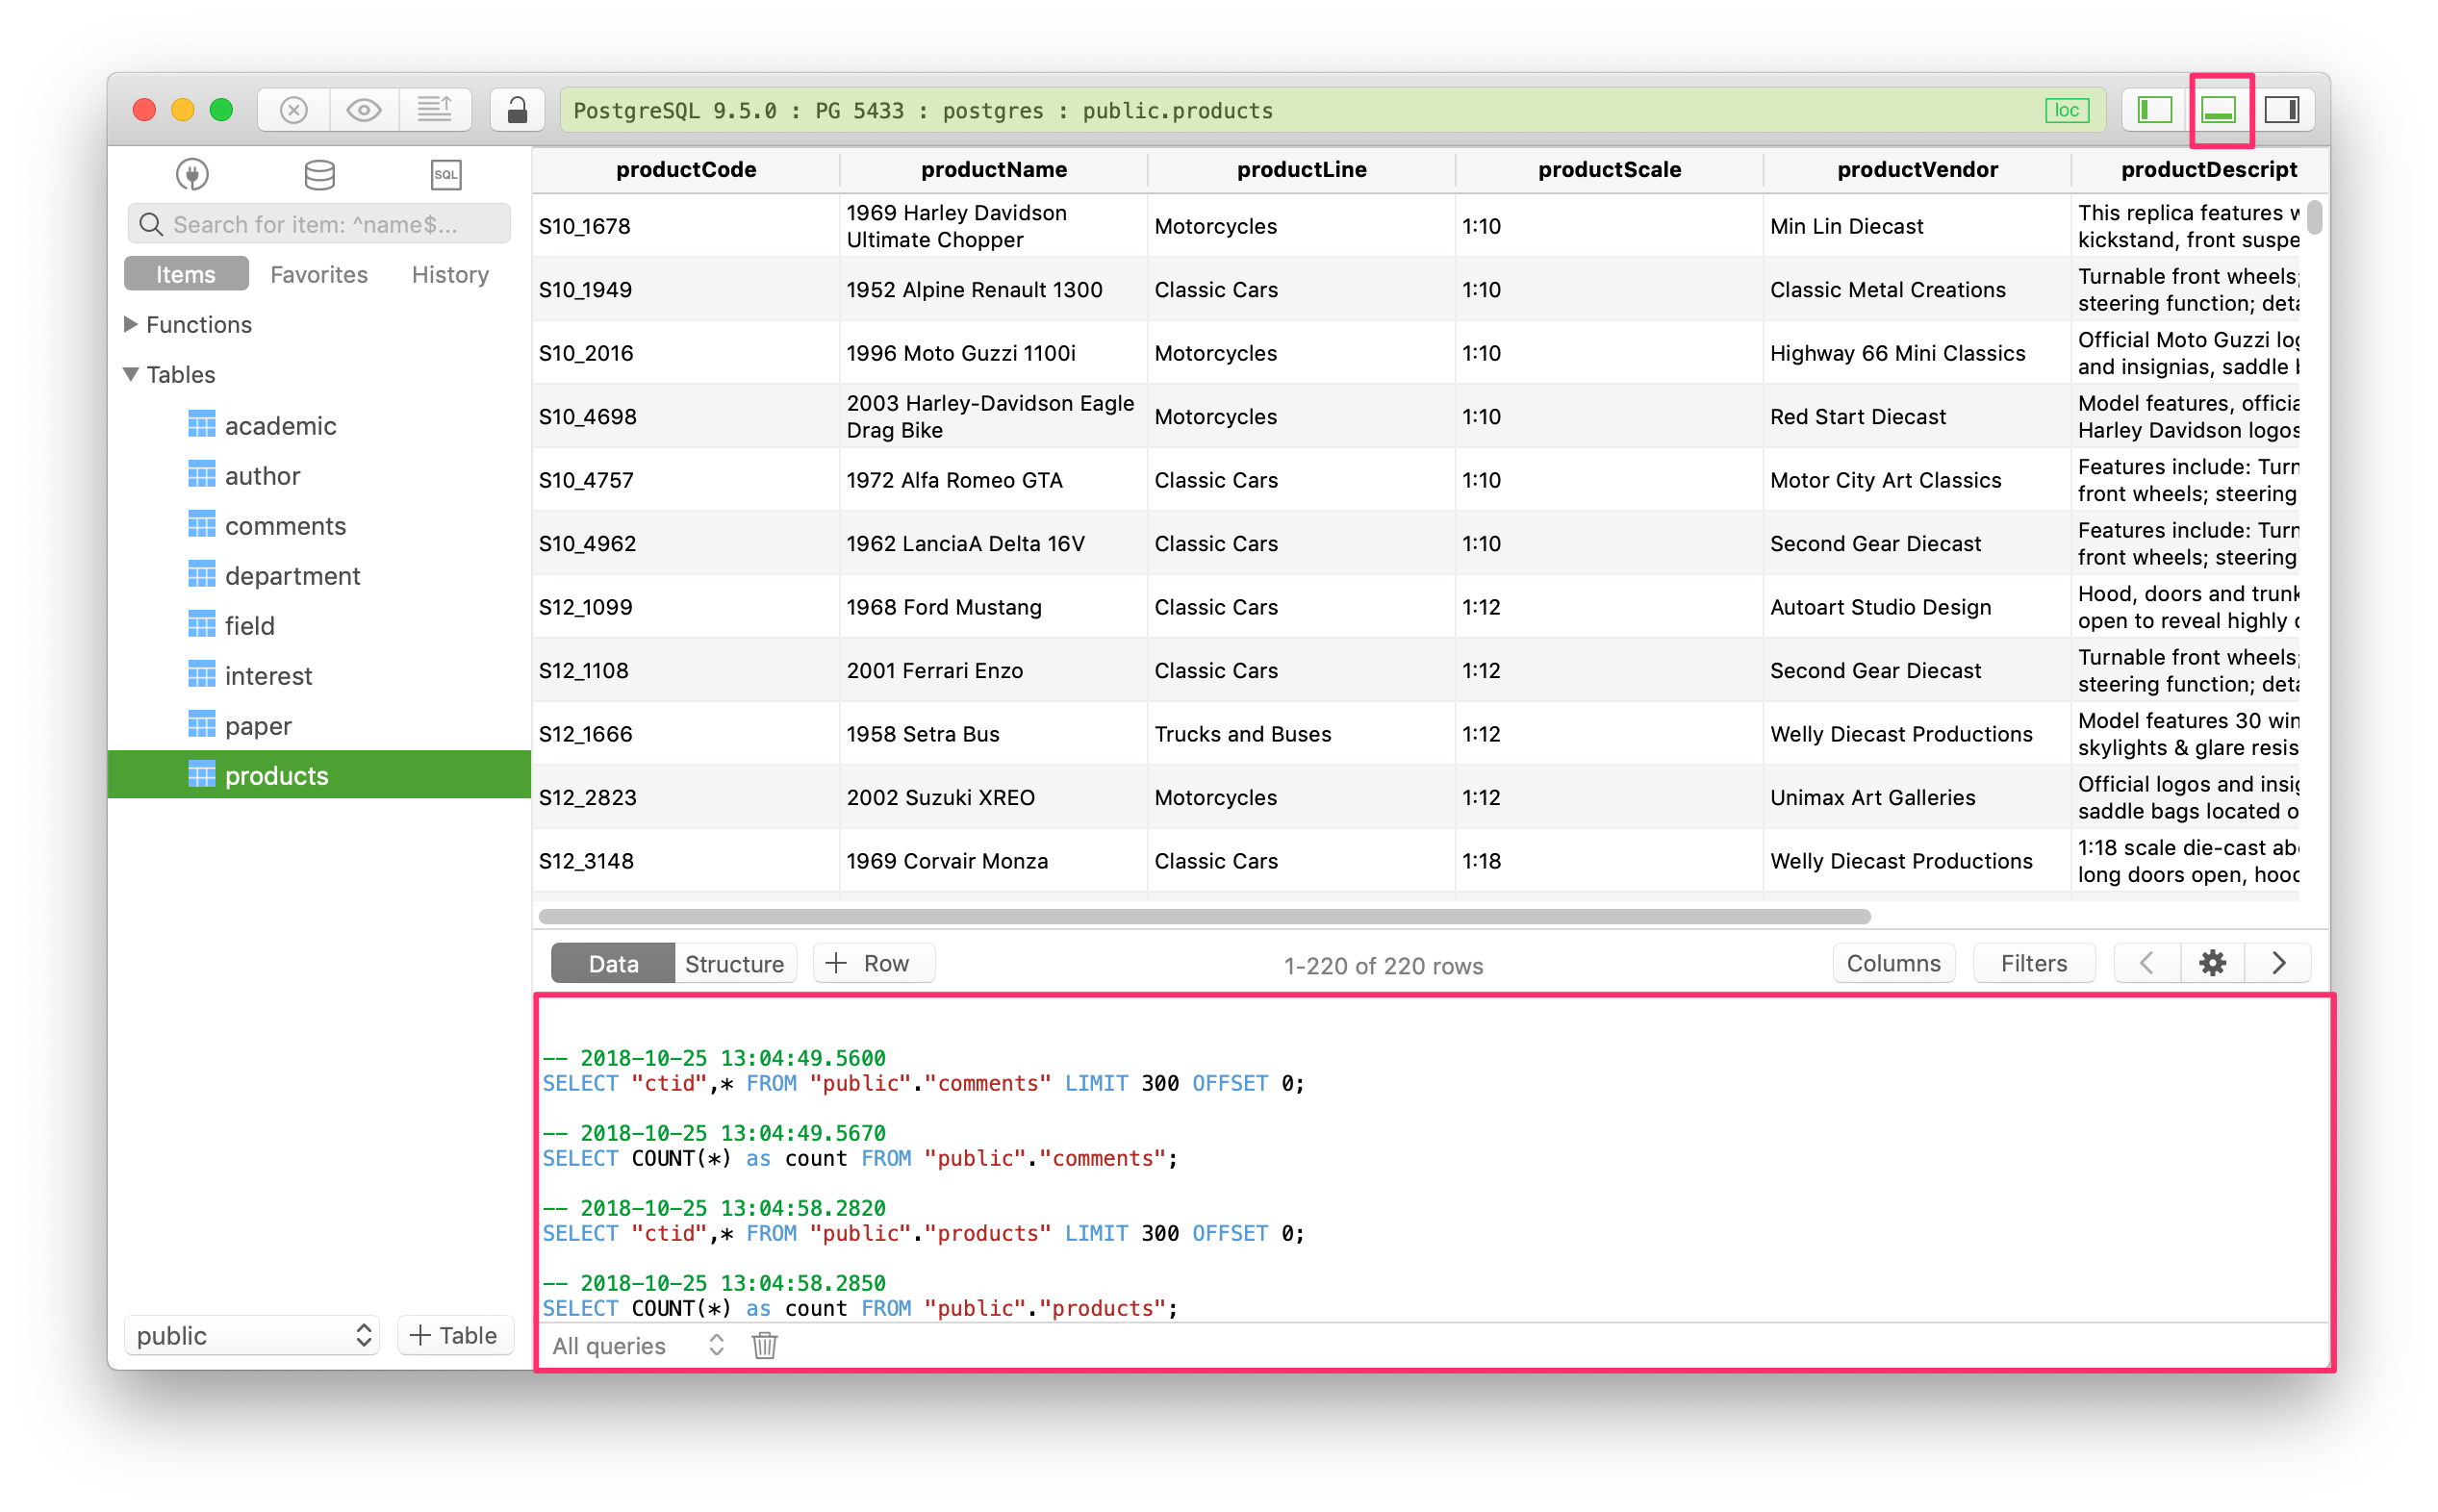
Using TablePlus, you can enable the console log via the GUI and see all the queries.
To do that, click on the console log button near the top right panel, or use the shortcut key Cmd + Shift + C.

You can also choose to log the meta queries, data queries, or all queries.
New to TablePlus? It’s a modern, native tool with an elegant GUI that allows you to simultaneously manage multiple databases such as MySQL, PostgreSQL, SQLite, Microsoft SQL Server and more.
Download TablePlus here. It’s free anyway!
