Working With Query Results
Each result tab below the SQL editor has three views, which you switch with the control on the result bar:
- Data: the rows returned by the query.
- Message: the messages from the server, such as the number of affected rows, errors, and PostgreSQL
RAISE NOTICEoutput. TablePlus also showsRAISE NOTICEmessages as notifications. - Chart: a chart drawn from the rows (see Draw a chart).
The result bar also shows the number of rows and the execution time, including network latency.
Edit query results
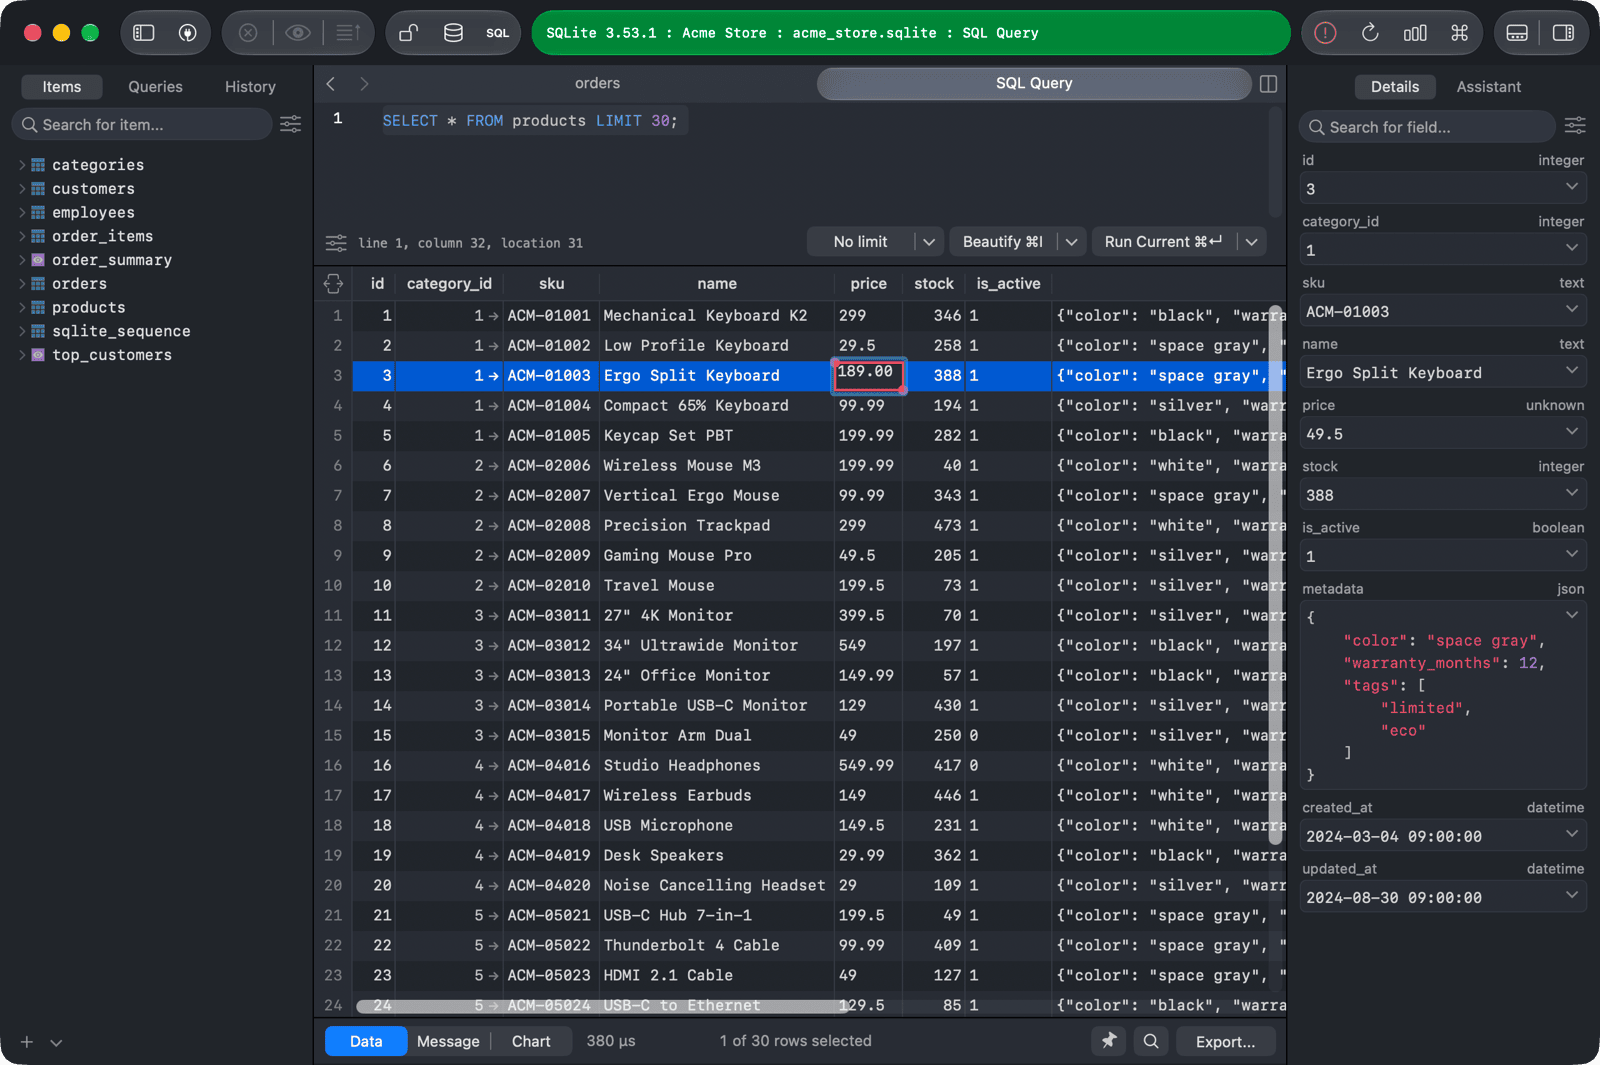
You can edit the rows of a query result the same way as in a table: double-click a cell to edit it inline, or select a row and edit it in the right sidebar. Right-click a cell for more options, such as Quick Look Editor, Set Value (EMPTY, NULL, DEFAULT or the content of a file), Duplicate and Delete.
Then press ⌘ + S to commit the changes.1
Copy rows
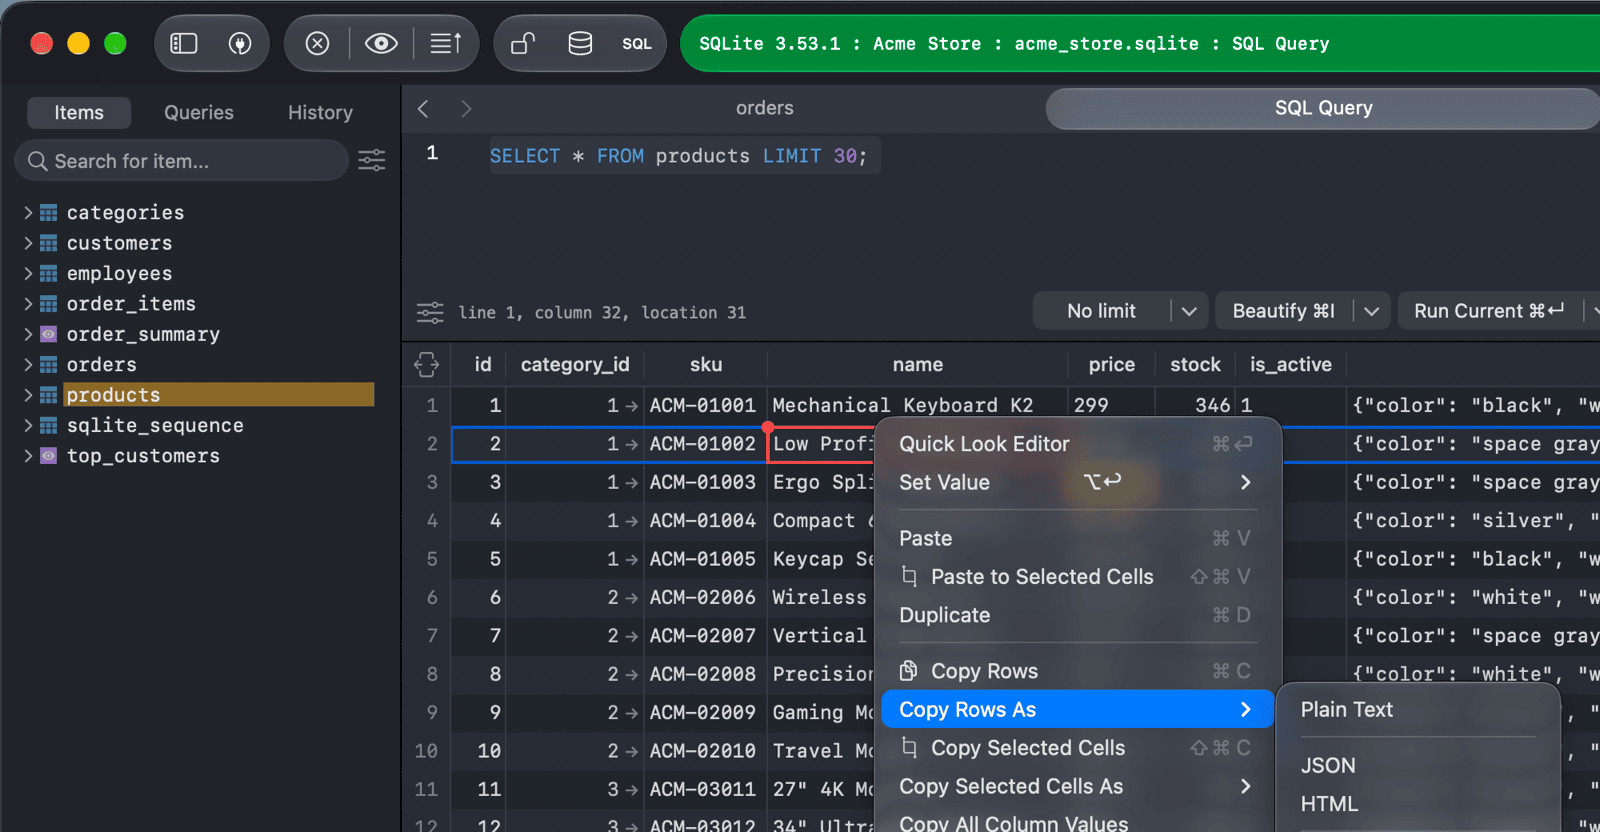
Right-click the selected rows and choose:
- Copy Rows (
⌘ + C) to copy them as CSV. - Copy Rows As to copy them as Plain Text, JSON, HTML, Markdown Table, CSV, CSV include fields name or SQL Insert Statement.
- Copy Selected Cells (
⌘ + Shift + C) or Copy Selected Cells As to copy only the selected cells. - Copy All Column Values to copy every value of the column.
Search and replace in results
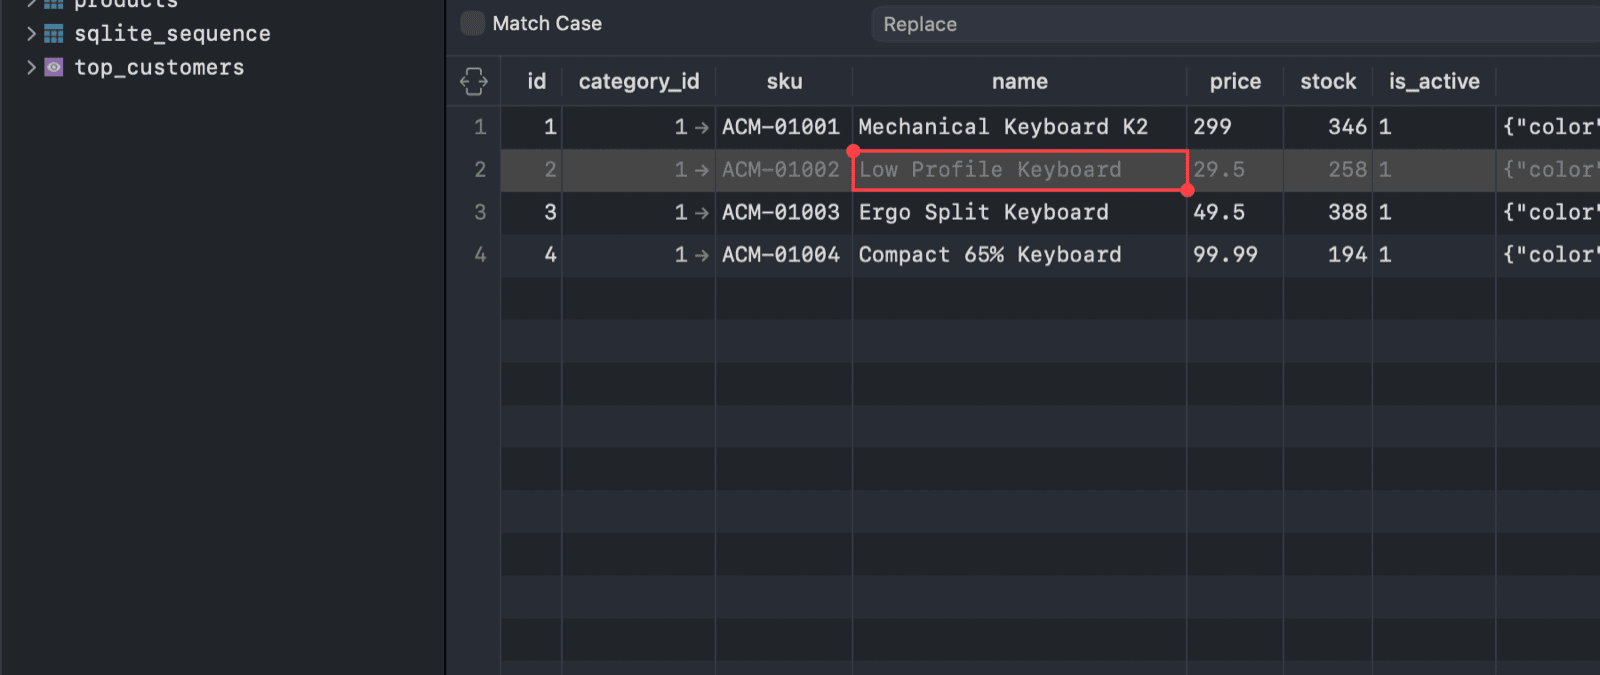
Click the search button on the result bar (or press ⌘ + F while the result is focused) to open the search pane. Choose a column (or Any column), an operator (Contains, Not contains, Has prefix, Has suffix) and type a value to filter the rows that are already loaded. Turn on Match Case for a case-sensitive search.
To replace values, type the replacement text in the Replace field, then replace the matches one by one or all at once. Commit the changes with ⌘ + S.
Draw a chart
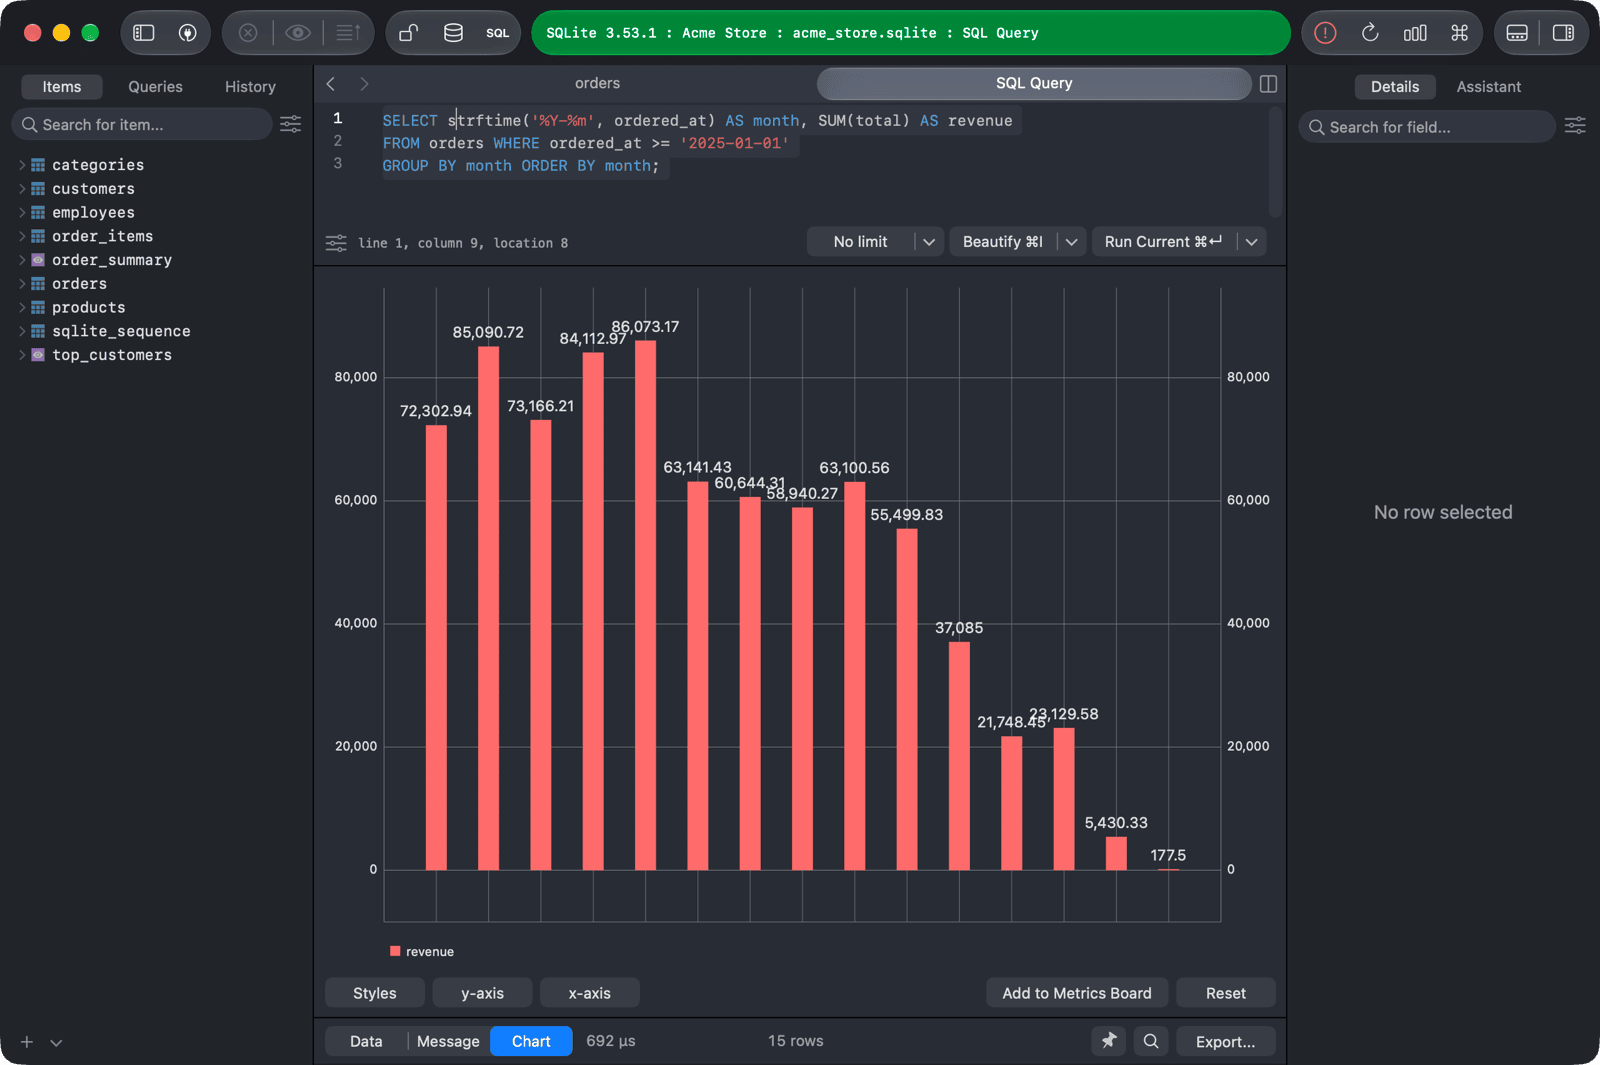
Open the Chart view of a result, then:
- Choose the chart style: Line Chart, Bar Chart or Pie Chart.
- Click x-axis to choose the column for the labels.
- Click y-axis to choose one or more columns to draw. For a pie chart, these buttons are label and value.
Click Add to Metrics Board to add the chart to a Metrics Board.
You can also tell TablePlus to draw a chart from a comment above the query. Start the comment with -- tableplus barchart, -- tableplus linechart or -- tableplus piechart (or simply -- barchart, -- linechart, -- piechart), then give the columns:
-- tableplus barchart x: month, y: revenue
SELECT strftime('%Y-%m', ordered_at) AS month, SUM(total) AS revenue
FROM orders
GROUP BY month;
For a pie chart, use label: and value: instead of x: and y:. To draw more than one column, repeat y:, for example y: revenue, y: orders.
Export query results
To export a result, click Export... on the result bar, or right-click the result and choose Export result... The export window lets you choose the format (CSV, JSON, SQL or EXCEL), its options, and the fields to export. See Import & Export for the format options.
When the query returned more than one result tab, Export... offers Export Result (the current tab) and Export Results from All Tabs.
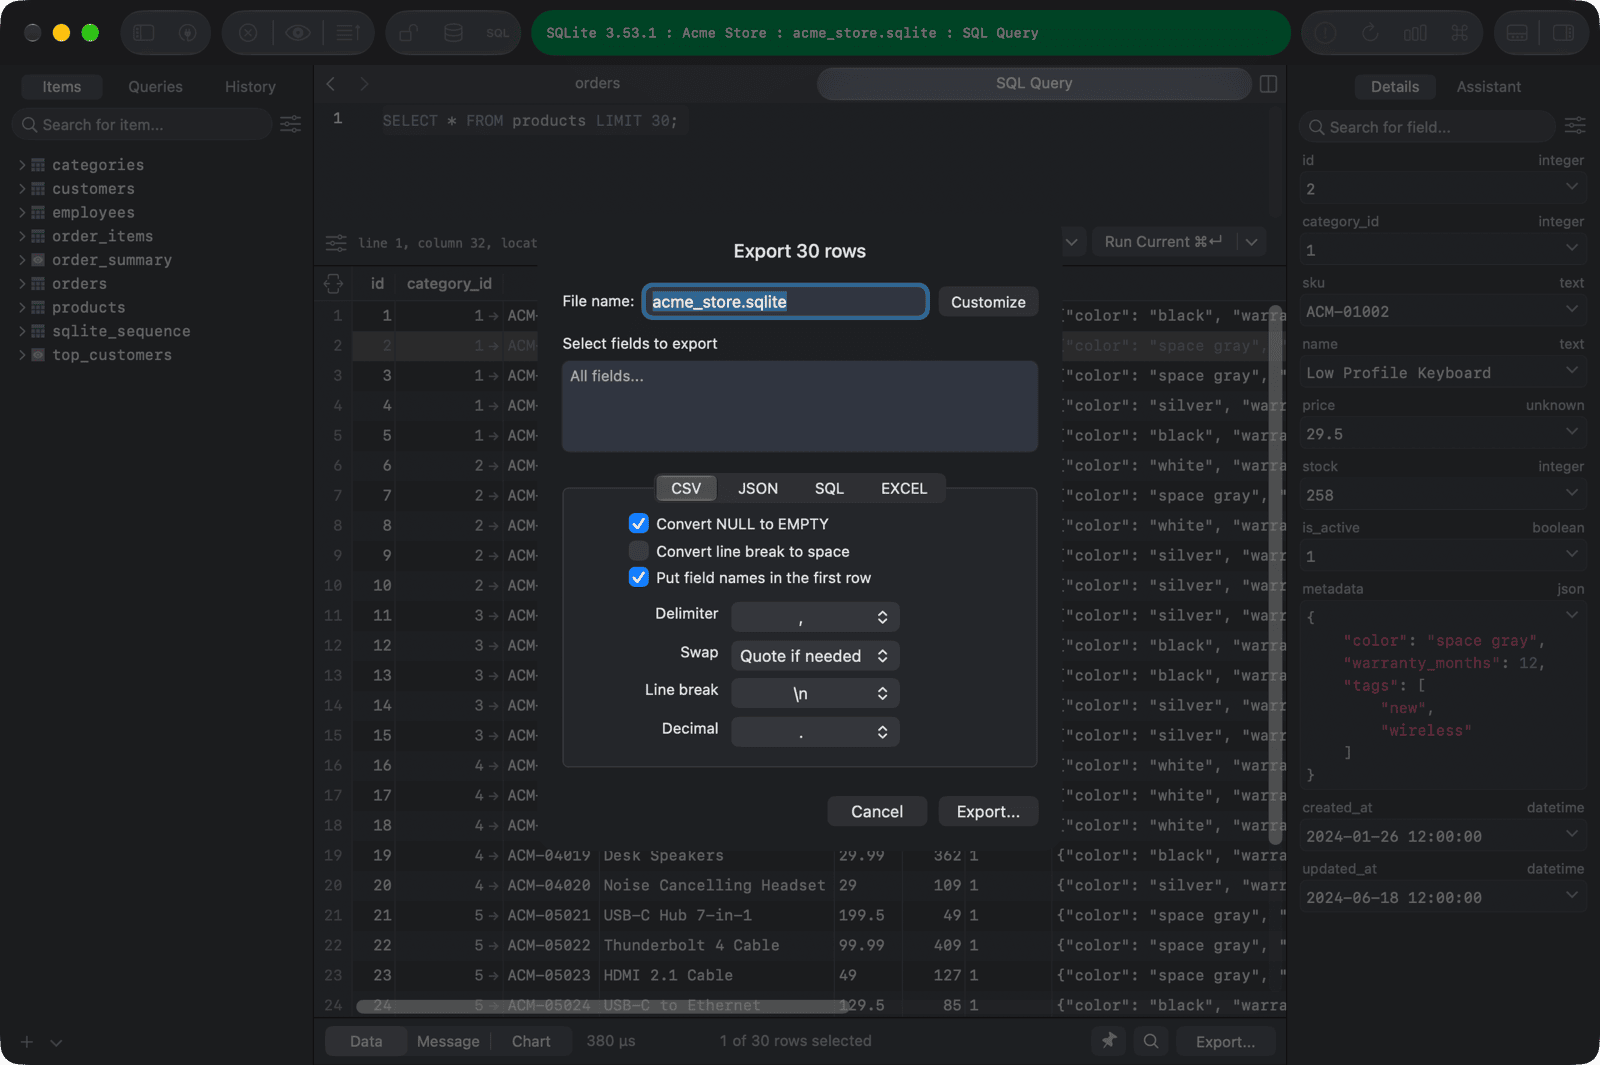
In the Message view, Export... saves the messages to a text file. In the Chart view, it saves the chart as a PNG image.
-
On Windows and Linux, use
Ctrlinstead of⌘. ↩︎