Toolbar
The toolbar at the top of the workspace window gives you one-click access to the most used actions: switching connections and databases, reviewing and committing changes, Safe Mode, the connection status, and the panel toggles.

Default items
From left to right, the default toolbar contains:
| Item | Description | Shortcut |
|---|---|---|
| Left | Show or hide the left sidebar | ⌘ + 0 |
| Connection | Open a connection | ⌘ + Shift + K |
| Discard / Preview / Commit | Discard, preview, or commit your pending changes | ⌘ + Shift + Delete / ⌘ + Shift + P / ⌘ + S |
| Safe Mode | Show and change the Safe Mode level of the connection | |
| Database | Open a database | ⌘ + K |
| SQL File | Open a new SQL Editor tab | ⌘ + E |
| Status | The connection status bar | |
| Notifications | Progress and results of exports and imports | |
| Reload | Reload the workspace | ⌘ + R |
| Metrics | Open the Metrics Board | |
| Command | Open Anything | ⌘ + P |
| Panels | Show or hide the console log and the right sidebar | ⌃ + ⌘ + C / Space |
Discard, preview, and commit
Changes you make in the GUI stay pending until you commit them. The three-part control on the left lets you:
- Discard: throw away all pending changes.
- Preview: see the SQL statements TablePlus generated for your changes.
- Commit: send the changes to the server.
The control is disabled while there is nothing to commit. For details, see Code Review & Safemode.
Safe Mode
The Safe Mode button shows the current Safe Mode level of the connection. Click it to choose another level:
| Level | Description |
|---|---|
| Silent Mode | Send queries to the server without any warnings |
| Alert Mode 1 | Warn before sending queries to the server |
| Alert Mode 2 | Warn before sending queries to the server, except SELECT/EXPLAIN/SHOW queries |
| Safe Mode 1 | Prompt for the password before sending queries to the server |
| Safe Mode 2 | Prompt for the password before sending queries to the server, except SELECT/EXPLAIN/SHOW queries |
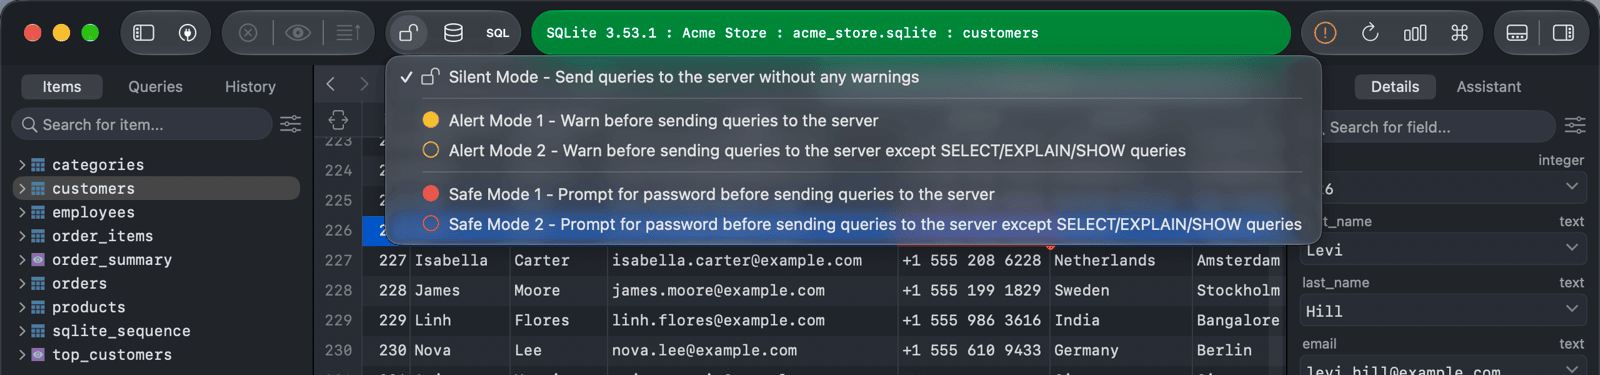
For details, see Safe mode.
Status bar
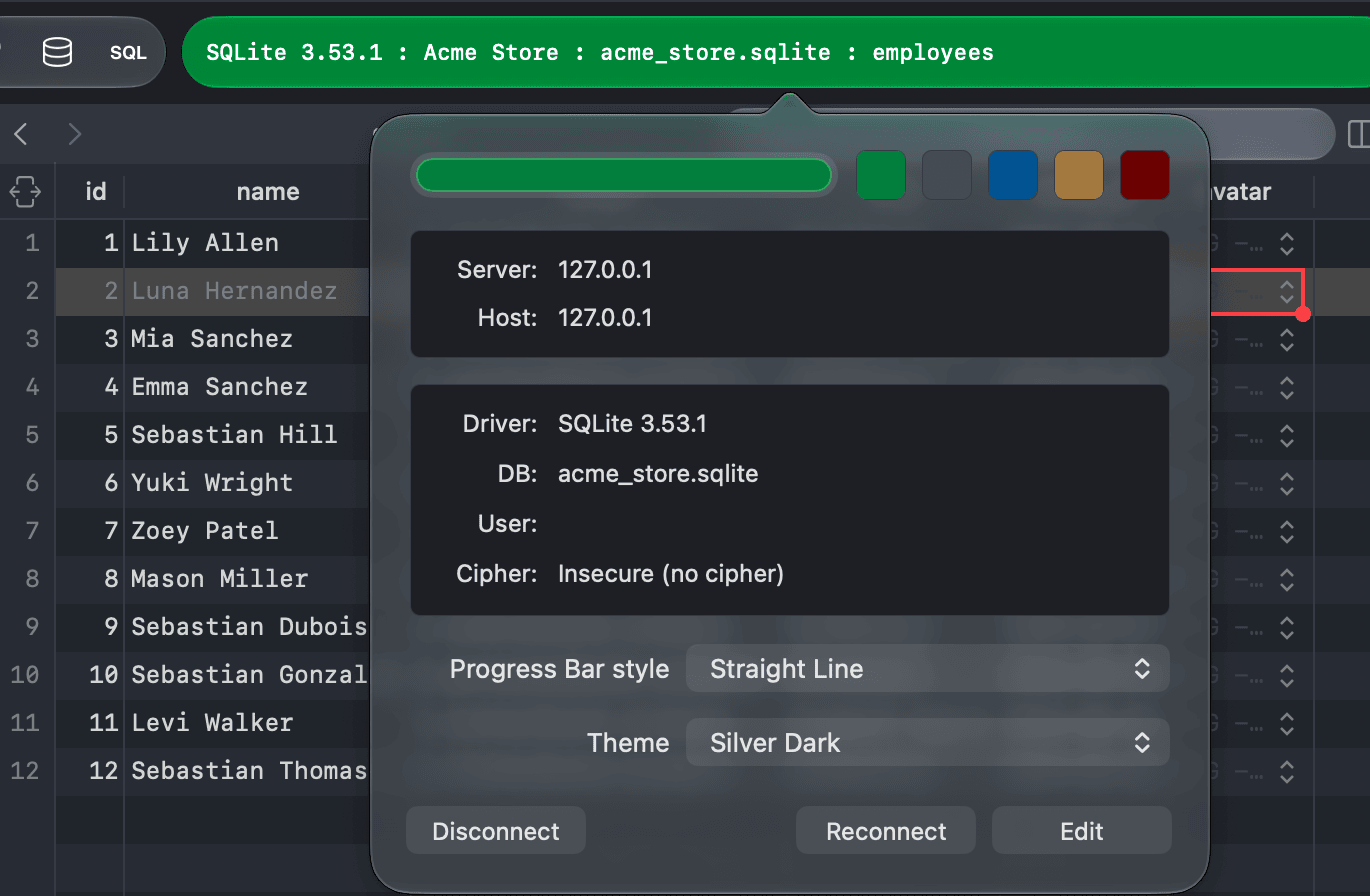
The status bar shows the current connection and database, the connection's tag (for example, PRODUCTION), and a progress bar while a query runs. Its color is the connection's status color.
Click the status bar to see the connection details (server, host, database, user, and TLS) and to change the status color. If the connection has dropped, clicking the status bar reconnects.
Notifications
The bell button lists license notices (Activate or Purchase while you use the trial, Renew... when your license has expired), update notices (Update..., or Install and Relaunch once an update is ready to install), and your recent exports and imports. Until TablePlus is activated, the button shows an orange exclamation mark instead of the bell; while an update is waiting, it shows a green arrow. While one runs, you can follow its progress here; when it finishes, you can see whether it completed or failed and open the folder of the exported file.
Reload
The Reload button reloads the current workspace with the latest data and structure from the server.
Open Anything
Quickly find and open a database, schema, table, function, saved query, or app feature. For more information, see Open Anything.
Panels
The Panels control toggles the console log (bottom) and the right sidebar (row details). The left sidebar has its own Left button at the far left of the toolbar.
Customize the toolbar
You can choose which items appear in the toolbar and arrange them the way you like, just as in other macOS apps.
- Right-click the toolbar and choose Customize Toolbar…. You can also open Open Anything (
⌘ + P) and choose Customize Toolbar. - Drag items into or out of the toolbar, or drag the default set to restore it.
- Click Done.
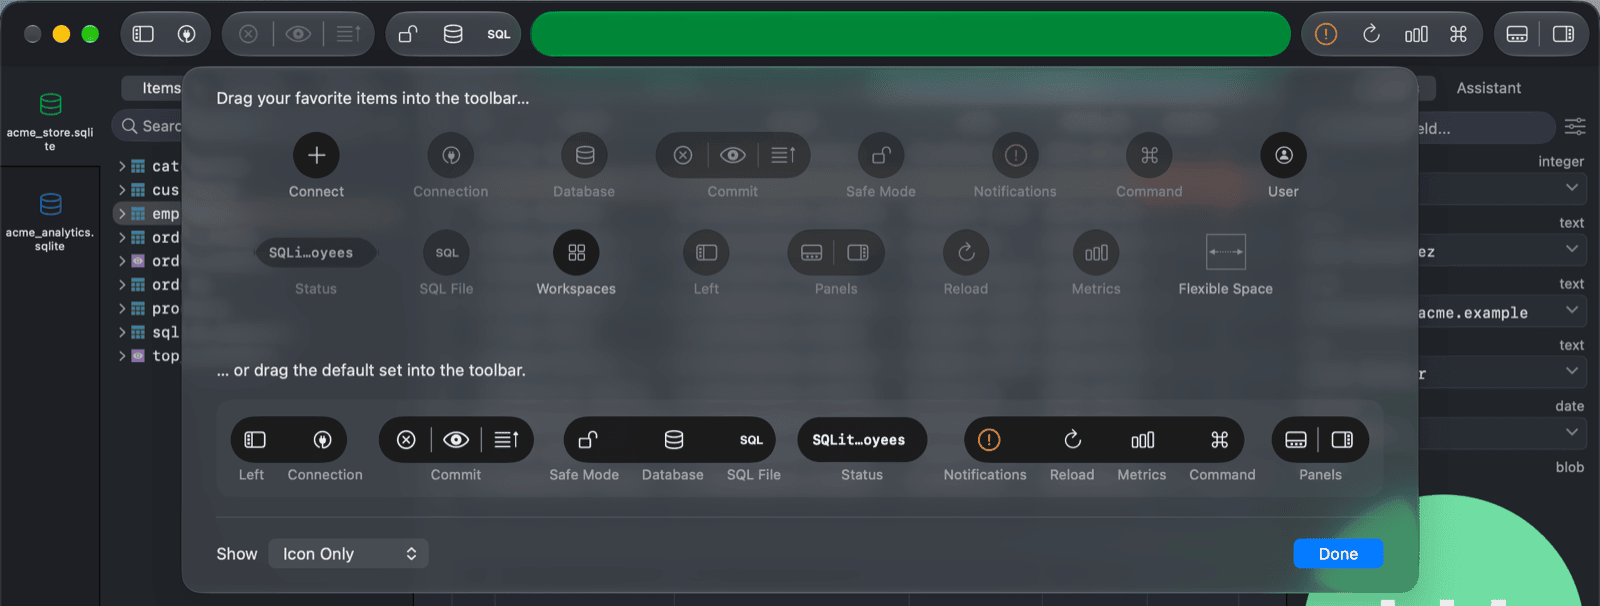
Besides the default items, you can add:
- Connect: a menu to open a database (
⌘ + K), open a connection (⌘ + Shift + K), or open a connection in a new window (⌘ + N) - User: open User Management (MySQL, MariaDB, and PostgreSQL)
- Workspaces: show all open workspaces so you can switch between them (
⌘ + Shift + \) - Flexible space